Following from the previous post on the Money Tree looking at the capital of the wealthy, lets have a look at incomes using the government’s statistics, Table 2.4
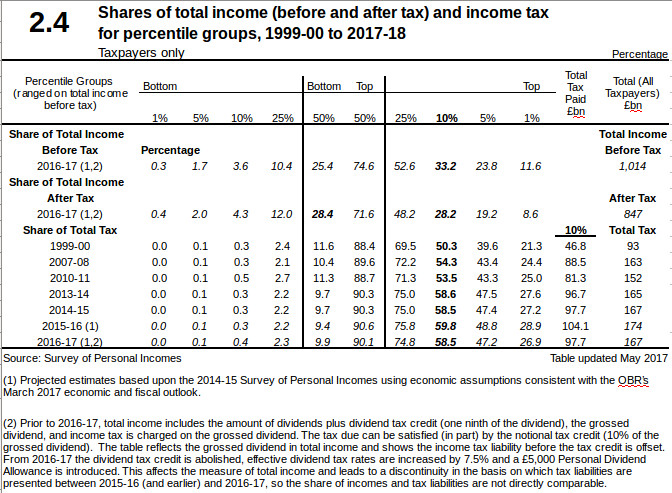
It has been reported that the wealthy are paying relatively more tax. This is true, 53.5% vs 58.5% for 2010-11 vs 2016-17. Since 2010, the increased burden is due to the increases in personnel allowances having a much greater effect on low incomes than high and how with increases in income from year to year more appears above the fixed tax thresholds. After the credit crunch in 2008 the total income tax take did not recover to 2008 levels until 2013-14. Similarly the top 10% did not pay more tax until 2013-14, £96.7 vs 88.5 billion (Total Tax paid column – my calculation) as these two factors exerted their effect which continued thereafter.
For 2016-17, after tax the top 10% still have £239 billion (28.2% of 847). The question is whether this is a Money Tree. Whether it is best for the country for this to be used by the wealthy or more to be taken as tax to support – defence, education, health care, transport, etc. There are arguments that taxing the wealthy has negative effects on the economy. These arguments mainly stem from the low tax, free market ideas of the ‘Chicago school‘ of economists including Milton Friedman.
The pros and cons have been reviewed here and need to be looked at more closely. These ideas took hold in part because Milton Friedman won the Nobel Prize (1976) and was famous. Politicians such as Margaret Thatcher and Ronald Regan became enamoured with his ideas and instituted policies accordingly, such as bank deregulation and tax reduction. Some of the ideas were sound but unfortunately for most people others were not. Friedman’s analysis relied on statistical models of the economy that assumed data transparency and rapid flows of information to the market such that the market carries out timely corrections and there can be no boom/busts, no technology bubbles, etc. Also the models included no human behaviour component – no possibility of bull/bear runs and no costs for damage to the environment. Hence in several major ways the assumptions were not and are not true and the economic deductions were false. These became particularly apparent with the financial crisis in 2008 which was allowed by the flawed ideas on deregulation and in its aftermath during which the UK governments have still followed some of the flawed ideas.
Some of the particular points about the effect of taxes will be considered next time.
Pingback: The Money Tree (Part 1) - Wrong Views