During the election campaign and more recently you may have heard Mrs May say “There is no Money Tree”. You may have also heard independent economists on the news say “Not much can be obtained from taxing the rich”. So, that’s how it is. Or is it? Lets have a look.
There is a discussion of Mrs. May’s statement here. This looks at the ‘Money Tree’ from a somewhat different perspective. I will consider the Money Tree simply to be an ongoing extra source of money for the government beyond current 2017 sources.
Much talk about wealth and tax refers to incomes e.g. here. However, most of the wealth of the wealthy is held as capital and so these discussions do not really address the main component of the issue. I will look at incomes later.
Unless indicated otherwise, figures are from: Piketty, Capital in the 21st Century, Belknap Press/Harvard, 2014.


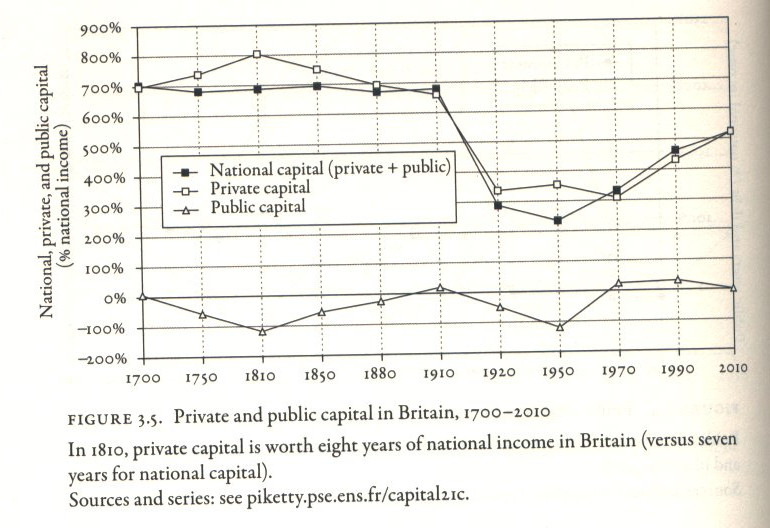
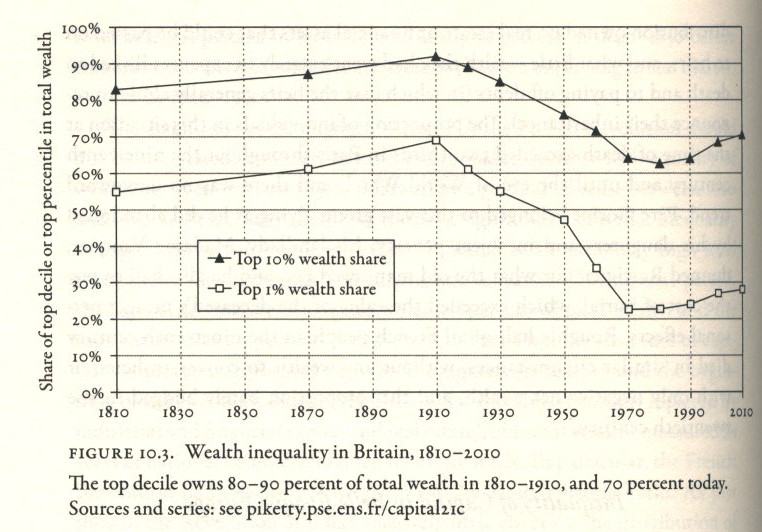
Fig. 3.5 shows private capital, 1970-2010, has increased from 300% to 520% GNI (220% or 2.2 x GNI, gross national income). In 2016 values (GNI=1.92 billion) this is 2.2 X 1.92 = £4224 billion. Over 40y = £106 billion per year. In 2010, the wealthiest 10% have 70% of this wealth = £75 billion per year, see Fig.10.3.
This trend is also shown by the recent report from the Office for National Statistics. Considering aggregate wealth (capital+income) this showed that from 2010-2012 vs 2012-2014 for the top 10% aggregate wealth increased by 21% but for the bottom 50% it increased by only 7%.
If you think it is OK for the wealthiest people in the country to keep increasing their proportion of the national wealth (from Fig.10.3 projected to reach about 80% by 2050) then that is how it should remain. However, if you think the wealthiest 10% have a large enough proportion or simply that alternatives to austerity need to be found, then this really is a ‘Money Tree’ (it grows and can be harvested regularly) and finding ways to tax it can generate up to £75 billion a year whilst still leaving the wealthy wealthy.
Next Incomes